Background
Crafty Pixels founder Faisal Zahid was a part of the network monitoring team at SLAC from 2010 to 2012. Under the mentorship of Dr. Les Cottrell, who was part of the Nobel Prize-winning team at Stanford Linear Accelerator.
Faisal collaborated on visualization tools for the PingER and Perfsonar projects.
I found Faisal to be an awesome mixture of hard-working, personable, skillful, and enthusiastic. This enabled him to quickly develop graphical user interfaces that were state of the art, attractive, functional, and accurately matched the customer needs.

Les Cottrell
Assistant Director at SLAC, Stanford University
PingER Overview
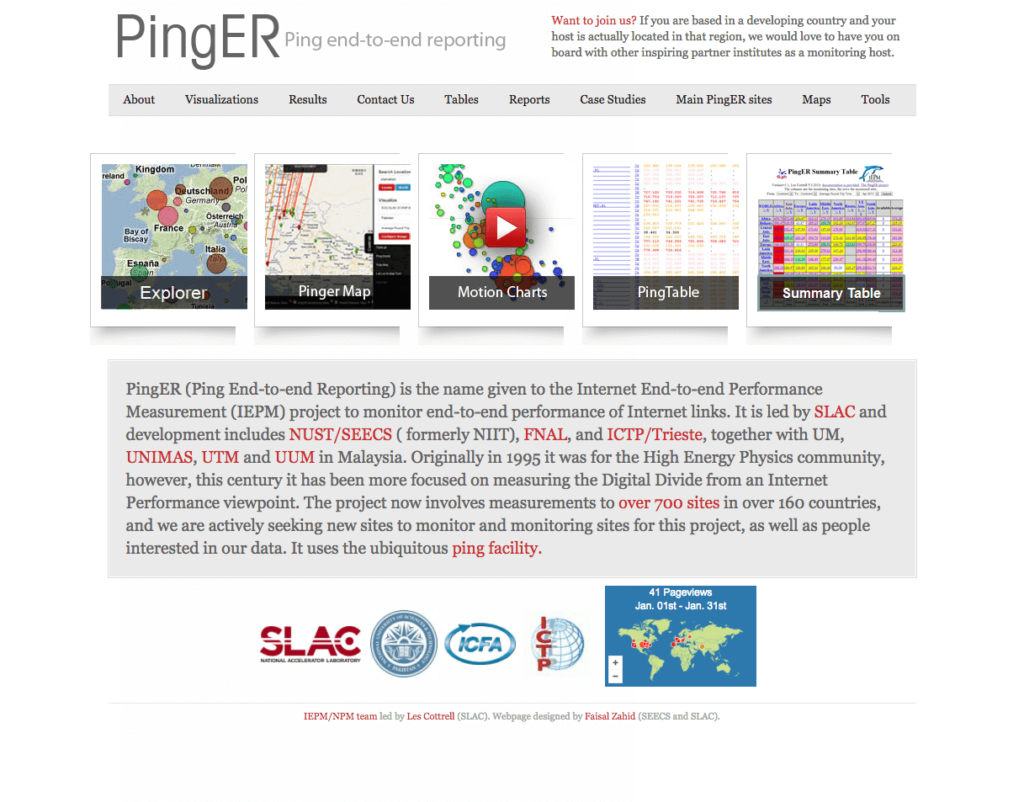
PingER (Ping End-to-end Reporting) is a project aimed at addressing the extraordinary network challenges presented by high-energy nuclear and particle (HENP) physics experiments.
These experiments generate massive amounts of data that need to be distributed via the Internet to collaborators at universities and institutes worldwide for analysis. The project’s purpose is to monitor end-to-end performance across networks to understand present performance and allocate resources to optimize performance between laboratories and collaborating institutes.
Goals
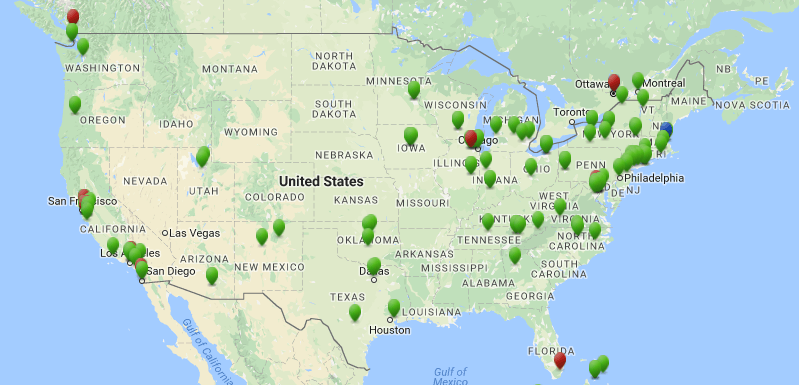
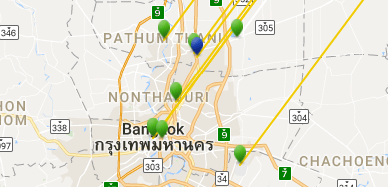
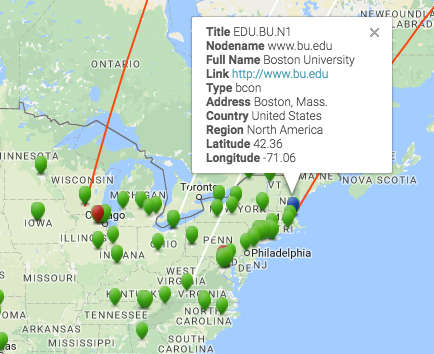
- Develop a visualization tool to provide an overview of the global distribution of PingER sites.
- Create a way to visualize connection health between sites to evaluate network bandwidth and diagnose network issues.
- Maintain up-to-date contact information for site administrators for effective communication and collaboration.
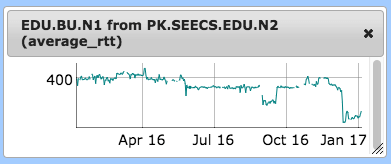
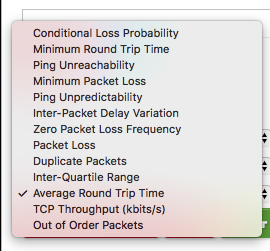
- Design a system to access and analyze performance metrics and historical data between sites to better understand network performance trends.
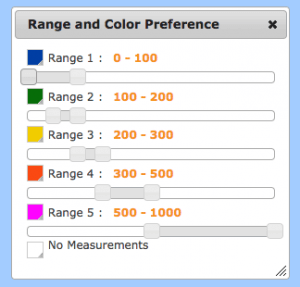
- Implement a feature to customize performance ranges for different countries based on their standard internet speeds.
Approach and Strategy
- Research and Analysis: Conducted a thorough analysis of the existing PingER project to identify areas of improvement and gather insights into user requirements.
- Design and Development: Designed a user-friendly interface for the PingER Map and Website that incorporated the project goals. Developed the tools using modern web technologies and Google Maps API for seamless integration and improved user experience.
- Testing and Validation: Ensured the tools’ accuracy, functionality, and reliability by conducting rigorous testing and validation. Gathered feedback from the SLAC team and made necessary adjustments.
- Implementation and Launch: Deployed the new PingER Map and Website, providing the SLAC team with an enhanced network monitoring and visualization platform.
- Ongoing Support: Continued to provide support to the SLAC team, addressing any issues and ensuring smooth operation of the tools.
Solution
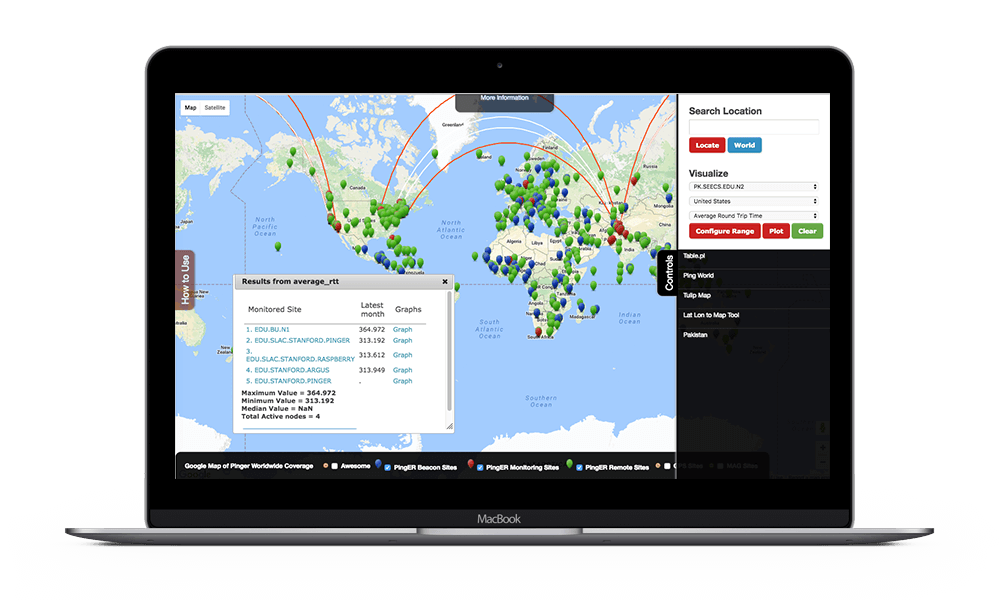
- PingER Map: Developed a Google Maps-based tool to visualize the locations of Pinger sites and their coverage in different countries.
- Connection Health Visualization: Enabled the visualization of connection health between sites to help evaluate network performance.
- Contact Details: Integrated a feature for admins to locate and reach out to site administrators.
- Performance Metrics: Provided access to various performance metrics and historical data for better network analysis.
- Range Configuration: Allowed admins to set custom performance ranges for different regions, accounting for varying internet speeds across countries.
Results and Success
The PingER Map and updated PingER Website have significantly improved SLAC’s ability to monitor network health worldwide, maintain up-to-date information on sites, and pinpoint problem areas in internet connectivity. The data gathered from these tools has been instrumental in assisting African nations in identifying optimal locations for setting up telecom towers to boost internet connectivity.
✓ Improved network performance monitoring and management for SLAC and its collaborators.
✓ Enhanced communication and collaboration among site administrators and network stakeholders.
✓ Enabled data-driven decision-making for optimizing network performance and resource allocation.
✓ Facilitated the identification of problem areas and the development of targeted solutions to improve internet connectivity in underserved regions.